
This is an especially slow week. We have Passover beginning on Wednesday, then Good Friday, followed by Easter at the end the week. So normally this would be a quiet time to begin with, but throw in a global pandemic and you would be hard pressed to find much of anything going on in SPAC Land right now.
With that in mind, many of us are also trying to read the tea leaves to get a sense of when this crisis will end. We’re all reading the same news, checking the stats, and parsing the medical and financial experts statements. Have we reached bottom? Have we reached the apex?
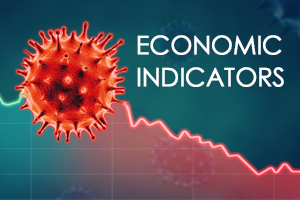
In light of that, a few additional stats, or “Covid-19 indicators” have been aggregated to see if any impart some guidance as to when the “tide will turn”. These aren’t SPAC related and, while mostly just interesting right now, might actually be useful in eventually showing us exactly when we’ve finally turned the corner.
FLIGHT RADAR
If you go to the Flight Radar’s website, they have some pretty cool charts showing the number of daily commercial flights from January 2020 through yesterday. Unfortunately, I can’t post a snapshot of the chart due to copyright issues, but you can view the charts via this link: FLIGHT RADAR
As you can see, daily commercial flights on a 7-day rolling average are down 71% compared to the January 2020 daily average. That’s a significant drop, but keep in mind that it’s most likely much worse since many airlines are flying “ghost flights” so airlines can protect their “slots” at major airport hubs. The International Air Transport Association (IATA) World Slots Guidelines (WSG) has a rule that states that if an airline successfully uses its slot at least 80% of the time, it is allowed to retain the slot the following season, through a system known as “grandfather rights.” Hence, you have airlines continuing to run flights with no one on them. Although, all airlines have since reduced their scheduling, but they are still flying, which is why the you don’t see that number even further reduced.
Additionally, Mike McAllister, who is now writing for the SPACInsider site and has an energy background, said that, “in 2018, daily jet fuel consumption was 1.7 million barrels/day (MMb/d) implying a 1.2 MMb/d drop in demand. And yesterday would make day 10 of about this level of activity. For context the U.S. consumes ~20.0 MMb/d and Jet fuel is about 8.5% of that total.” Clearly, this is a significant drop. However, any pick up in both fuel demand and commercial flights could be interpreted as an improvement in the current Covid-19 situation.
TSA
As long as we’re talking about travel, there’s another interesting chart to be found on the TSA website: TSA .Gov
As you can see, the chart illustrates TSA checkpoint travel numbers for 2020 versus 2019. Total traveler throughput was 95% lower yesterday than a year ago and 94% lower using a 7-day rolling average. With 50,000 TSA active agents this means there are 2.2 travelers for each agent. You know it’s bad when there are more TSA agents than actual travelers….
BOX OFFICE
Going to the movies seems particularly unappealing right now. No one is looking to be jammed in with about 100-200 people in a windowless room for two hours in the middle of a pandemic. Hence you get results like this from Box Office Mojo, which tracks the gross receipts from movie theaters across the country and world wide.
Granted, this is only showing through April 6th, but as you can see for April, in the entire United States, only $4,347 in proceeds have been collected at the box office. That’s not in millions, it’s really just $4,347 dollars. Frankly, I’m surprised anyone was brave enough to go to the movies in the first place. However, it will be interesting to see once lock-downs are eased if people will feel confident enough to go back to movie theaters. And as a reference point, there was $1,034,981,639 in box office receipts in April of 2019.
GOOGLE – COVID MOBILITY
Finally, Google has been “spying on us all” (basically) and tracking our movements through various apps, but the results do yield some interesting stats:
The reports themselves chart movement trends over time by geography, across different categories of places such as retail and recreation, groceries and pharmacies, parks, transit stations, workplaces, and residential. So if you look at NY State, for instance, you will see a -62% reduction in the retail and recreation category and, unsurprisingly, a -46% reduction in workplaces. However, if you look at say, Arkansas, you will see only a -29% reduction in retail and recreation and a -27% reduction in the workplace category. Clearly, different states are in different phases of infection rates, but it’s still fascinating to look at the differences.
All told, by reviewing sites such as these, it gives us a more thoughtful view into how the Coronavirus is shaping behaviors and maybe it gives us some insight into when those behaviors change, and more importantly, when the economy will eventually begin to turn.
At the SPAC of Dawn There are signs that the macro environment for SPACs is gradually improving, but the Screaming Eagle team yesterday announced a non-redemption agreement for its combination with Lionsgate Studios. Such agreements are generally a lever one pulls when a SPAC expects a potentially turbulent closing. All in all, the terms for...
Israeli tech firms have made up an outsized proportion of SPAC activity and despite the ongoing tensions in its region, that dealmaking is continuing unabated. In fact, the SPAC named for the particular mission of taking Israeli firms public through SPACs, Israel Acquisition Corp. (NASDAQ:ISRL) in fact just took one step closer in completing that...
At the SPAC of Dawn Although the market has largely recovered from a negative stretch last week, the roller coaster is tilted back downward for Trump Media (NASDAQ:DJT), which slid -8% yesterday to $32.57 – one of its lowest points since closing with Digital World last month. Other SPACs and de-SPACs are having a more...
Remember the metaverse? Many do not. Meta’s (NASDAQ:META) attempted transition to virtually living and working seemed to mark a trend that went up and down quickly, but one SPAC deal has both survived that roller coaster and may rise with a second. Back in December 2022, Newbury Street (NASDAQ:NBST) announced a $1.85 billion combination with...
At the SPAC of Dawn Tucked into the bill that provides $95 billion in funding to American allies passed by the House this weekend is another measure that is likely to have far more impact on at least one pending deal in SPAC world. It would appear that the timing was fortuitous for TikTok rival...